Senior Research Fellow (SRF) · IIT Roorkee

Rakesh Naik

I read molecules by the light they scatter. My work sits where surface-enhanced Raman spectroscopy, plasmonic nanostructures and machine learning meet — building optical platforms that identify a pathogen or a biomarker in minutes, from a signal one photon in a billion strong.

Centre for Photonics and Quantum Communication Technology · Indian Institute of Technology Roorkee · research group of Prof. Sachin Kumar Srivastava.

A surface-enhanced Raman spectrum A simulated SERS spectrum from 400 to 1800 wavenumbers, with five labelled bands: tyrosine at 850, phenylalanine ring breathing at 1002, Amide III at 1250, CH2 deformation at 1450, and Amide I at 1655 reciprocal centimetres. 400 800 1200 1600 RAMAN SHIFT (CM⁻¹) 850 cm⁻¹ Tyrosine ring, Fermi doublet 1002 cm⁻¹ Phenylalanine ring breathing 1250 cm⁻¹ Amide III · N–H bend, C–N stretch 1450 cm⁻¹ CH₂ / CH₃ deformation 1655 cm⁻¹ Amide I · C=O stretch, α-helix
Hover or tap a marked band to see what it is
Rakesh Naik, Senior Research Fellow (SRF) in Raman and SERS spectroscopy at IIT Roorkee
Rakesh Naik · Centre for Photonics and Quantum
Communication Technology, IIT Roorkee

About

The short version

I am a Senior Research Fellow (SRF) at the Centre for Photonics and Quantum Communication Technology (CPQCT), IIT Roorkee, working with Prof. Sachin Kumar Srivastava (Department of Physics and CPQCT). My subject is what light gives away about matter — specifically, the vanishingly small fraction of scattered photons that come back carrying a molecule's vibrational signature.

Most of my time goes to surface-enhanced Raman spectroscopy: designing plasmonic substrates that amplify that signature by orders of magnitude, and then working out how much of the result is the sample and how much is the substrate. The current application is a receptor-free platform that identifies respiratory viruses from their intrinsic spectrum, with machine learning doing the separation that no single band can.

The rest goes to the things that make the first part usable. I wrote RNSpectraX because a reproducible analysis pipeline should not require three programs and two undocumented settings. I record Lab2Life because a result nobody outside the field can follow is only half finished.
Position
Senior Research Fellow (SRF), CPQCT
Group
Applied Plasmonics and Photonics (APP) Lab, IIT Roorkee
Method
SERS · plasmonics · imaging
Also builds
RNSpectraX (spectral analysis) · RNBeamX (optical setup figures)

What I work on

Four threads, one question

How little of a molecule can you detect, how fast, and how certain can you be about what it is? Each thread below attacks a different part of that question — the surface, the signal, the platform, and the analysis.

Surface

SERS biosensing without receptors

Raman scattering is famously weak — roughly one photon in a billion. Park a molecule nanometres from a plasmonic surface and that signal jumps by orders of magnitude. I build substrates that hold analytes in those hot spots reproducibly, so the enhancement is a measurement rather than an accident, and detect targets by their intrinsic fingerprint instead of a labelled receptor.

SERSNanoplasmonicsLabel-free
Signal

Machine learning on spectra

A biological SERS spectrum is a crowded superposition: hundreds of overlapping bands, a drifting fluorescence background, and sample-to-sample variation that dwarfs the difference you care about. Classifiers trained on properly preprocessed spectra separate classes that no single band distinguishes — provided the preprocessing is honest about what it removes.

ImagingClassificationPreprocessing
Platform

Photonic and fibre-optic sensing

A spectrometer on an optical bench is not a diagnostic. Fibre Bragg gratings, waveguide couplers and integrated optical elements move a measurement from the bench toward something field-deployable, and each introduces its own trade-off between sensitivity, robustness and cost.

Fibre opticsFBGOptical sensing
Analysis

Reproducible spectral software

Two labs applying "baseline correction" to the same spectrum can publish different peak ratios. RNSpectraX exposes every processing choice — despiking threshold, baseline order, smoothing window — so a pipeline can be reported precisely and reproduced exactly. It runs entirely in the browser, so no data leaves the machine that measured it.

Scientific softwareReproducibilityOpen workflow

Software

RNSpectraX

A full Raman and SERS analysis workspace that runs in a browser tab. Built because moving spectra between three pieces of proprietary software to make one figure is not a workflow — it is a reproducibility problem.

  • Reads your spectrometer. Ocean Optics, Horiba/LabSpec, Renishaw WiRE, Bruker, WITec, JCAMP-DX, binary SPC and plain two-column, detected automatically.
  • Cleans the signal properly. Cosmic-ray removal that leaves sharp bands intact, five baseline models including iterative ModPoly and asymmetric least squares, Savitzky–Golay and three other filters — each with its parameters on screen.
  • Averages groups with real statistics. SD or SEM, as capped bars or shaded bands, computed across replicates you tag by name.
  • Finds what differs. The cross-file analyser clusters peaks across every loaded spectrum into common bands and sample-specific bands.
  • Plots and fits any XY data. A general scientific plotter with error bars and weighted least-squares fitting that reports every parameter with its standard error.
  • Keeps your data yours. Everything is computed in the tab. Nothing is uploaded, ever.

How to cite (APA and BibTeX) · Cite as: Naik, R., & Srivastava, S. K. (2026). RNSpectraX (Spectral Plotter and Analytics Suite) (Version 3.4) [Computer software]. Zenodo. https://doi.org/10.5281/zenodo.23593680

RNSpectraX (Spectral Plotter and Analytics Suite)
RNSpectraX plot: baseline-corrected group-average Raman spectra of a control and a treated group (n = 3 each), with the peaks found and labelled automatically, from 400 to 1800 cm⁻¹.

A real RNSpectraX result: ALS baseline correction, group averages and automatic peak labels (synthetic demonstration spectra).

Software

RNBeamX

An optical setup designer for publication figures and graphical abstracts. You place the optics; the light is traced for you, so the figure is also a working model of the experiment.

  • Beams that obey optics. Mirrors, splitters, lenses, wave plates, gratings, prisms and fibres act on the light, including polarisation, dispersion, Gaussian waists and interference.
  • Three looks, one layout. Line-art schematic, shaded journal style, or a 3D optical table with glowing beams.
  • Ready for submission. Journal column presets, a reviewer-style journal check, and SVG, PDF, TIFF and PNG export at true size.
  • Animated. Keyframe any part, light flow and pulses, camera orbits, exported as MP4 for talks.
  • Works with RNSpectraX. Send a processed spectrum straight across and it becomes panel b of the same figure.

By Rakesh Naik and Sachin Kumar Srivastava, IIT Roorkee. Runs entirely in the browser; nothing is uploaded. · How to cite (APA and BibTeX) · Cite as: Naik, R., & Srivastava, S. K. (2026). RNBeamX (Optical Setup Designer) (Version 1.2) [Computer software]. Zenodo. https://doi.org/10.5281/zenodo.23697703 · Works hand in hand with RNSpectraX: send a processed spectrum straight across as panel b.

RNBeamX (Optical Setup Designer)
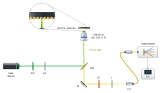
SERS Raman microscope drawn with RNBeamX: a 532 nm laser, band-pass filter and half-wave plate, a dichroic mirror sending the beam up through a 50× objective onto a SERS substrate (with a zoomed inset of the nanoparticles), and the Raman signal returning through a long-pass filter and lens into a fibre to the spectrometer and PC.

Exported from RNBeamX as vector SVG: every beam is traced by the app.

RNBeamX · 3D animation

Rendered by RNBeamX: the 3D view on a brushed stainless-steel table, a turntable swing and light flow.

How it has gone so far

Research journey

2024

Into Raman and optical sensing

Started advanced work on Raman spectroscopy and optical sensing at the Centre for Photonics and Quantum Communication Technology, and began pairing spectral measurement with machine learning.

2025

A receptor-free SERS platform for respiratory viruses

Developed a machine-learning-integrated SERS platform for rapid respiratory virus detection — identifying targets from their intrinsic vibrational fingerprint rather than from a bound receptor, which removes the reagent that is usually the slowest and most fragile part of a diagnostic.

2026

RNSpectraX, and taking the science outward

Released RNSpectraX (Spectral Plotter and Analytics Suite), presented at the OPTCT + SeNcity conference at IIT Roorkee, and started publishing science communication — explainers and lab footage — under Lab2Life.

Get in touch

Collaborations, questions, or a spectrum that will not behave

I am glad to hear from anyone working on SERS substrates, spectral classification or optical diagnostics — and from students thinking about a PhD in photonics.